

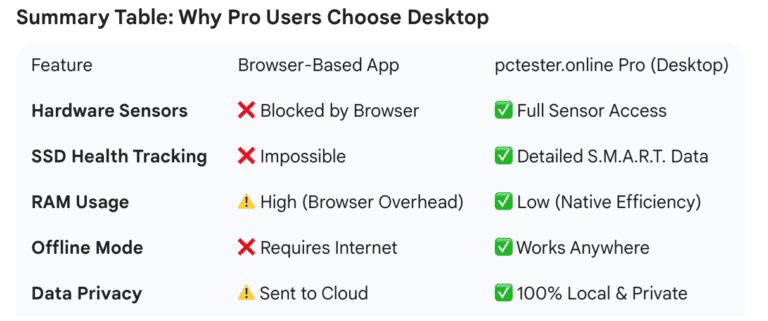
Desktop software like pctester.online Pro provides a level of depth and reliability that is technically impossible for a browser-based application to achieve.
While websites (web apps) are convenient because they don’t require installation, they are essentially “trapped” inside a security sandbox. For a system diagnostic tool, this makes the desktop version far superior for four primary reasons:
The Definitive Guide to pctester.online- Pro for macOS & Windows
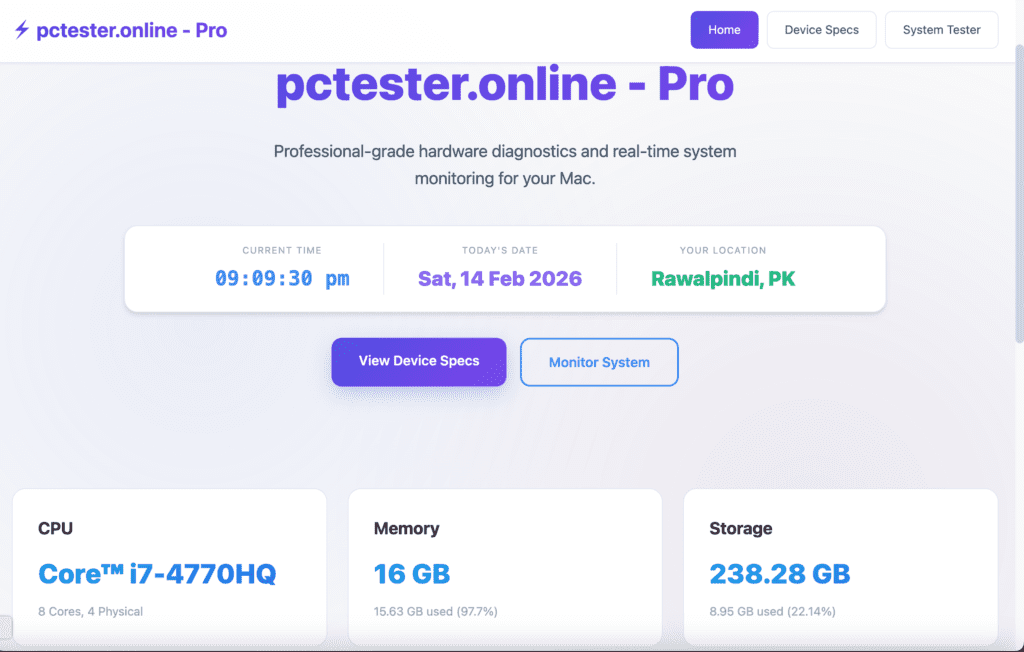
Dynamic Dashboard and Localization
Upon launching the application, users are greeted with a clean, high-fidelity interface that provides immediate situational awareness:
Real-Time Clock and Date: Displays the current system time and date for precise logging.
Geolocation: Automatically detects and displays your current location (e.g., Islamabad or Rawalpindi, PK).
Navigation Hub: Quick-access buttons allow users to toggle between Device Specs for hardware deep-dives and Monitor System for live performance tracking.
Instant Vital Stats
The home page features three primary cards that give an “at-a-glance” summary of the machine’s core components:
CPU Information: Identifies the specific processor model (e.g., Core™ i7-4770HQ) along with core counts, such as 8 Cores and 4 Physical cores.
Memory Utilization: Shows total installed RAM (16 GB) and a live percentage of current usage (e.g., 99.9% or 97.7%).
Storage Health: Displays the total capacity of the primary drive (238.28 GB) and tracks exactly how much space is currently occupied.
Privacy and Permissions Management
Unique to its professional positioning, the home page emphasizes transparency regarding system access. A dedicated System Permissions section informs users about the status of critical hardware interfaces:
Hardware Monitoring: Tracks permissions for Microphone/Audio and Bluetooth Hardware.
Advanced Diagnostics: Notifies the user if “Full Disk Access” or “Screen Recording” permissions are required to unlock deep SMART stats or granular graphics info.
User Guidance: Includes a “Why this matters?” resource and a “Tip” bar to help users navigate macOS Privacy & Security settings to ensure the app can function at full capacity.
Security & Permission Guard
A unique section dedicated to transparency and app integrity.
Permission Audit: Shows the real-time status of system-level permissions like Full Disk Access, Microphone, and Bluetooth Hardware.
Educational Sidebar: Includes a “Why this matters?” section to explain to the user why certain hardware permissions are necessary for accurate diagnostics, building Trust (EEAT).
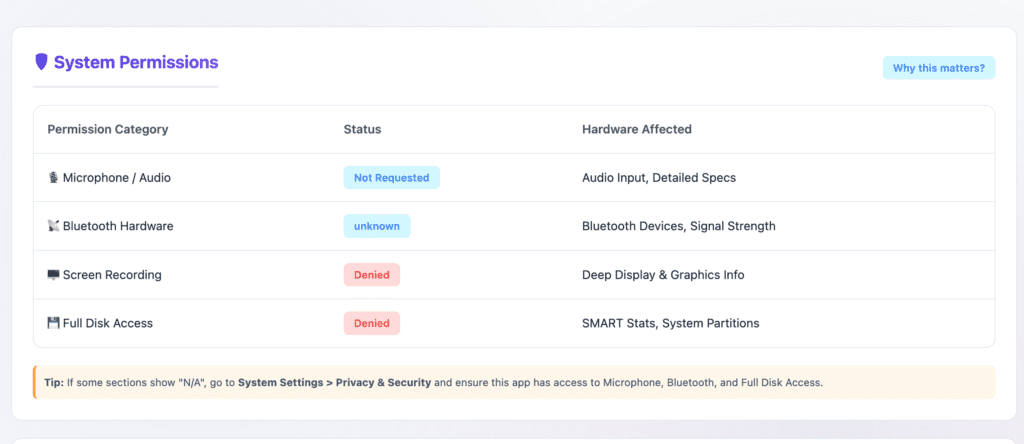
System Permissions
System Permissions
This section shows whether the application has access to essential system features required for advanced diagnostics and monitoring.
Permission Checks Include:
Microphone / Audio – Indicates if the app can read audio input devices and gather sound-hardware details.
Bluetooth Hardware – Verifies the ability to detect and analyze nearby Bluetooth components.
Screen Recording – Determines whether screen capture is allowed for visual performance monitoring.
Full Disk Access – Enables deep storage inspection and advanced drive-health analysis.
Tip:
If any permission is disabled, the tool provides step-by-step guidance to enable it through the operating system’s Privacy & Security settings so users remain fully informed and in control.
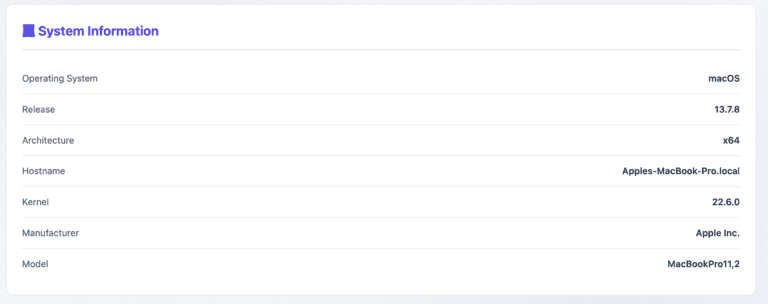
System Information
Provides a technical overview of the device’s operating environment.
Details Displayed:
Operating system name and version
System architecture (32-bit or 64-bit)
Host and kernel information
Device manufacturer and product identifier
This information helps confirm compatibility with software, drivers, and enterprise deployment requirements.
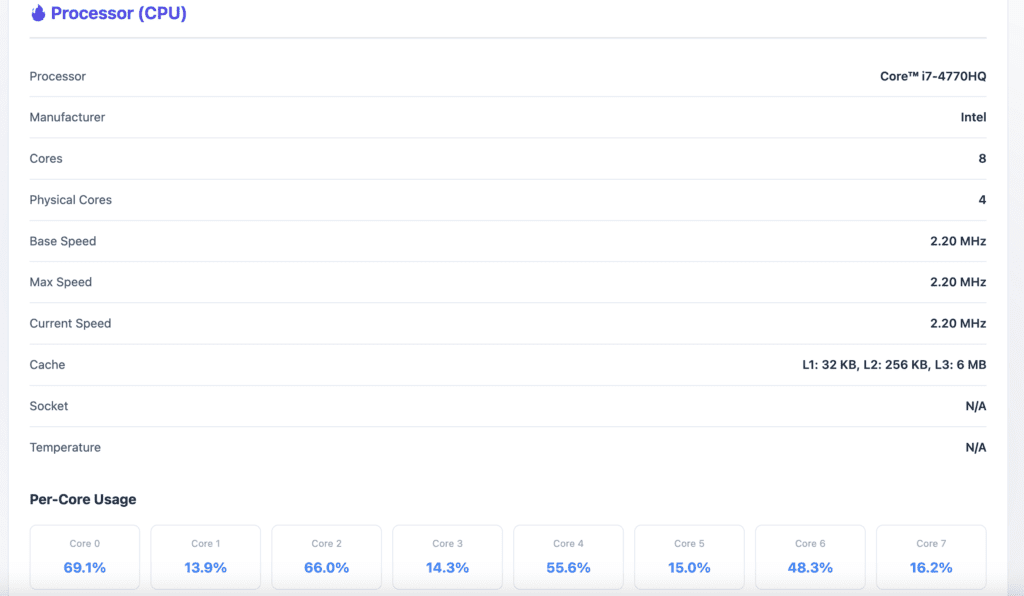
Processor (CPU) AnalyticsAdd Your Heading Text Here
Monitors and evaluates processor performance in real time.
Includes:
Processor model name
Physical and logical core count
Base, maximum, and current clock speeds
Cache levels (L1, L2, L3)
Live per-core utilization
These metrics help identify heavy workloads, bottlenecks, and inefficient resource usage.
Highlights:
- Processor Model: Intel Core i7‑4770HQ
- Core Details: 8 total cores (4 physical, 8 logical threads)
- Clocks: Base, Max, and Current operational speed.
- Cache Overview: L1, L2, and L3 cache values for performance optimization.
- Per‑Core Usage: Dynamic display for per-core workload distribution in real-time.
Memory (RAM) Usage
A complete breakdown of system memory activity for troubleshooting and optimization.
Key Metrics:
Total installed memory
Used vs. available memory
Active and idle memory states
Swap / virtual memory usage
Individual memory module information (capacity, speed, manufacturer)
A visual usage indicator offers quick insight into whether applications are consuming excessive memory.
Key Metrics:
- Total Memory: 16 GB
- Used vs. Free Memory: Indicates available resources and current workload.
- Active and Available States: Helps assess memory efficiency.
- Swap File Usage: Monitors virtual memory usage.
- Memory Modules: Detailed information about each slot, capacity, speed (1600 MHz DDR3), and manufacturer (Hynix Semiconductor Inc.).
The visual Memory Usage Bar provides a quick performance insight — excellent for diagnosing high memory consumption or app inefficiencies.
Graphics and Display
Shows the system’s graphical processing capabilities and screen characteristics.
Graphics Details:
Graphics processor type
Available video memory
Connection type (integrated or dedicated)
Display Details:
Display name or panel type
Screen resolution
Color depth
Connection interface (internal or external)
This information assists with performance analysis, rendering diagnostics, and display calibration.
Identify graphical performance and display capabilities of the system.
Graphics Information:
- Model: Intel Iris Pro
- VRAM: 1536 MB
- Bus Type: Built-in Integrated GPU
Display Details:
- Model: Color LCD
- Resolution: 1440 × 900 pixels
- Pixel Depth: 32-bit for accurate color rendering.
- Connection: Internal Display
This feature benefits creators and developers by offering clarity on rendering performance, screen resolution, and display calibration potential.
Storage
Physical Drives
Lists all detected drives along with:
Drive name or identifier
Storage type (e.g., solid-state or other)
Total capacity
Interface and connection bandwidth
Vendor details (if available)
Device serial reference
Partitions & Filesystems
Shows how storage is divided and used:
Mount location
Filesystem type
Total size
Used space
Available space
Usage percentage indicator
This helps diagnose low storage conditions, improper partitioning, or excessive disk consumption.
Network
Displays real-time network interface information for both wired and wireless connections.
For Each Interface:
Interface name
Connection type (wired / wireless / virtual)
IPv4 address
IPv6 address
MAC address
Link speed
Current status (active, inactive, or unknown)
This section is useful for troubleshooting connectivity issues, verifying active adapters, and monitoring network activity.
Resource Monitoring (Battery Section)
This function tracks the health and real-time status of physical components. Instead of just showing “on” or “off,” the software performs complex calculations:
State Estimation: It calculates “Time Remaining” by analyzing current power draw against the “Current Capacity.”
Health Tracking: It compares the Max Capacity (what the battery can hold now) against its original factory design to give you a Battery Health percentage (88.3%).
Cycle Logging: It increments a counter every time the battery undergoes a full discharge/charge cycle (77 cycles in your case).
Hardware Abstraction & Identification (Audio/USB Sections)
This is a core function where the software identifies what is “plugged in” and translates that for the Operating System.
Enumeration: The software scans the system buses (like USB) to list every connected device, such as the Bluetooth USB Host Controller or the 2.4G Receiver.
Metadata Reporting: It retrieves specific details like the Manufacturer (Apple Inc., YICHIP) and the Device Type (Hub, Controller, Storage).
Status Indicators: It provides a simplified “Online” or “Offline” status, hiding the complex electrical signals happening in the background.
Input/Output (I/O) Management
The “Audio Devices” section highlights the software’s role in directing data flow:
Routing: It distinguishes between In (Microphone) and Out (Speakers).
Driver Interface: While not explicitly named, this software is interacting with drivers—the specific code that tells the hardware exactly how to vibrate a speaker cone or capture sound waves.
This function manages the “queue” and communication pathways for external hardware that isn’t always active.
Status Polling: The software regularly pings connected devices to determine if they are offline or ready.
Abstraction of Identity: It translates complex hardware IDs (like the long UUID strings shown for the Canon TS8300) into human-readable names.
Preference Management: The software allows the user to designate a “Default” device (indicated by the star icon), which tells the Operating System where to send data first.
Environmental Scanning & Signal Processing (Wireless/Bluetooth)
The software acts as a “radar” for the device, continuously scanning frequencies to detect nearby signals.
Signal Analysis: In the Wireless (WiFi) and Nearby Networks views, the software measures signal strength in decibels (-48 dBm to -68 dBm). This helps users understand their range and potential connection quality.
Protocol Identification: The software identifies security protocols like WPA2 and assigns specific Channels (e.g., 1, 7, 11) to avoid interference from other routers.
State Tracking: In the Bluetooth section, the software maintains a database of “Known” vs. “Connected” devices, tracking which headsets (like Airbud 590) or mice are paired but currently inactive.
Security & Access Auditing (User Sessions)
This is a critical security function that monitors who—or what—is currently interacting with the system hardware.
Session Tracking: The software logs the specific User (apple), the exact Login Date (2026-02-13), and the Login Time (17:07).
Interface Logging: It identifies the TTY (Teletype) or terminal type—in this case, “console”—which tells administrators if the user is physically at the machine or logged in remotely.
Live Performance Analysis (Real-Time Monitoring)
The software functions as a continuous diagnostic monitor, providing a high-level overview of a system’s operational health.
Metric Aggregation: The software collects raw data and converts it into accessible percentages, such as Memory Usage or CPU Usage, to show how much of the system’s total capacity is currently engaged.
Temporal Tracking: It generates visual trend data, such as usage graphs over time, allowing users to distinguish between consistent workloads and brief performance “spikes”.
Process Inventory: The software maintains a live count of all active Processes, representing every background task or user application the system is currently managing.
Multi-Core Orchestration (Per-Core Usage)
Modern processors are divided into multiple independent processing units (cores). The software acts as an orchestrator to manage this complexity.
Load Balancing: The software monitors how work is distributed across different cores, ensuring that tasks are spread out to prevent any single core from becoming a bottleneck or overheating.
Granular Visibility: By providing data for each individual core, the software allows for detailed analysis of whether specific applications are efficiently utilizing the available multi-core architecture.
.
Memory & Virtualization Management (RAM/Swap)
This function manages the system’s short-term memory resources to prevent crashes during high-demand periods.
Physical Resource Allocation: The software tracks exactly how much physical RAM is occupied by active data versus how much remains available for new tasks.
Virtual Memory (Swap) Coordination: When physical memory limits are reached, the software manages a “Swap” or “Page” file, using a portion of the system’s storage drive as emergency overflow memory to keep the system stable.
Throughput Accounting (Network Activity)
Beyond establishing a connection, the software tracks the volume and speed of data moving across network interfaces.
Directional Tracking: It distinguishes between incoming (Download) and outgoing (Upload) traffic, providing real-time bitrates for each stream.
Data Auditing: The software maintains historical logs of Total Received and Total Sent data, which is essential for monitoring long-term usage or managing data caps.