How to Monitor Your Laptop or
PC’s CPU, GPU & FPS Stats

When watching a PC or a laptop review, you must have seen those tiny CPU, GPU, temperature, and FPS numbers showing on the screen when you are playing the game. The question that many people would ask themselves about these kinds of statistics is how the reviewers can show them and more importantly how they can view the same information on their own laptops to determine whether their device is doing well or there is a hidden problem.

The good news? All these performance measures can be easily viewed by yourself. And with new and improved tools and processors, the technique is even more trusted today. Here we have a step by step guide that will take you through the entire process.

MSI

MSI Afterburner

To keep a real-time track on your system performance you simply require the following tools:

MSI Afterburner

RivaTuner Statistics Server (RTSS)– this is included with MSI Afterburner.

HWInfo – necessary when Afterburner does not display some of the CPU/GPU specs on new CPUs/GPUs.

These three tools assist in showing temperatures, use percentages, power use, clock speeds and playing FPS during gaming.

MSI
Installation of MSI

Step 1: Install MSI Afterburner

Go to Google and write; MSI Afterburner.

Open an official MSI web site and download the tool.

You will have a ZIP file, just unzip it and install the application.

Select RivaTuner Statistics Server with RivaTuner do NOT unchecked during installation.

RTSS is needed to display on-screen statistics.

MSI Afterburner should then be opened.

Step 2: Configure GPU Monitoring

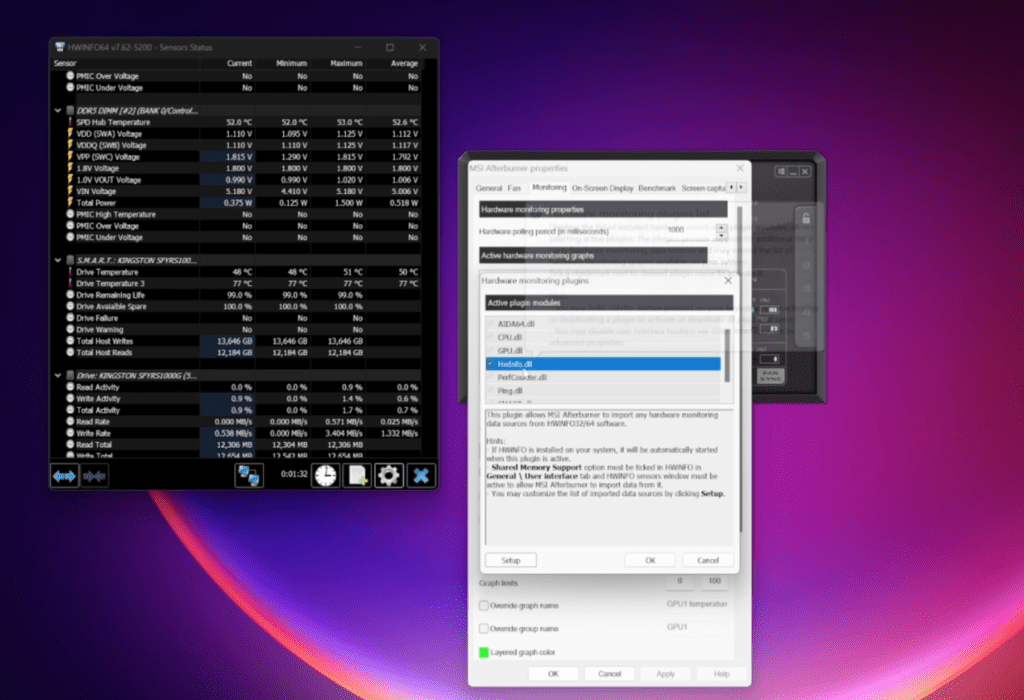
Inside MSI Afterburner:

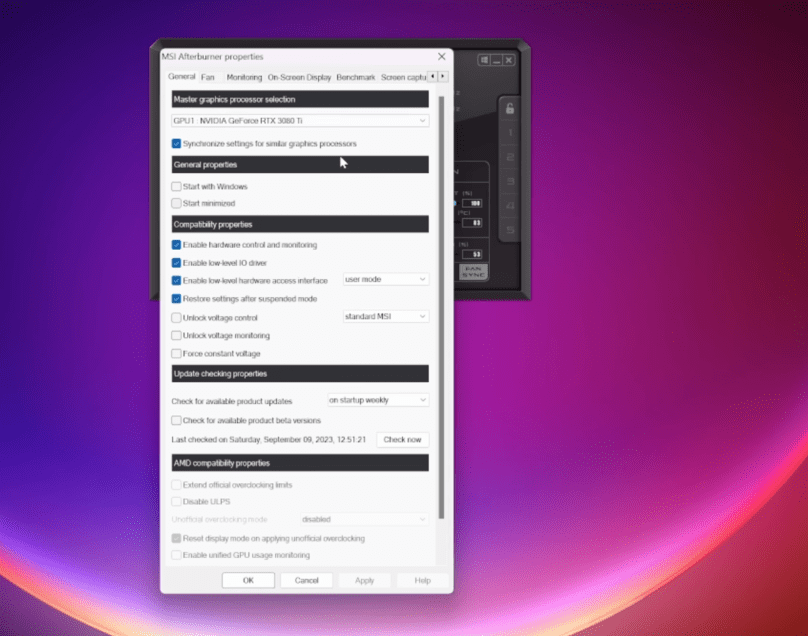
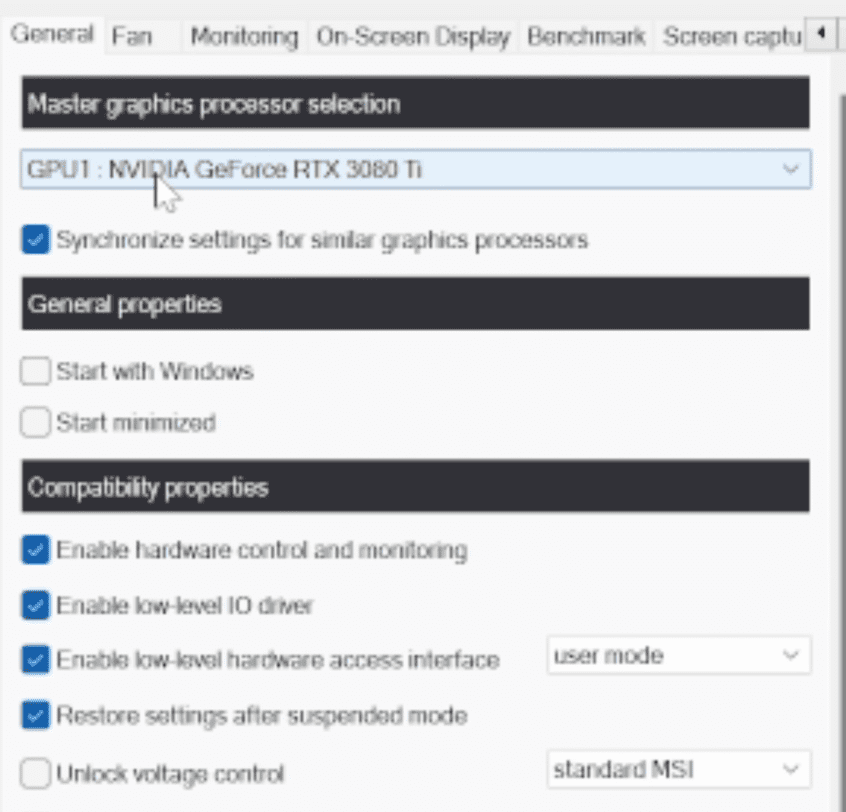
Open Settings (the gear icon).

On the General tab, you will be able to see GPU 1, GPU 2 etc.

The most common GPU is the dedicated GPU (NVIDIA/AMD) which is GPU 1.

The integrated GPU is commonly in the form of GPU 2.

Choose your dedicated GPU – the one that you would like to monitor.

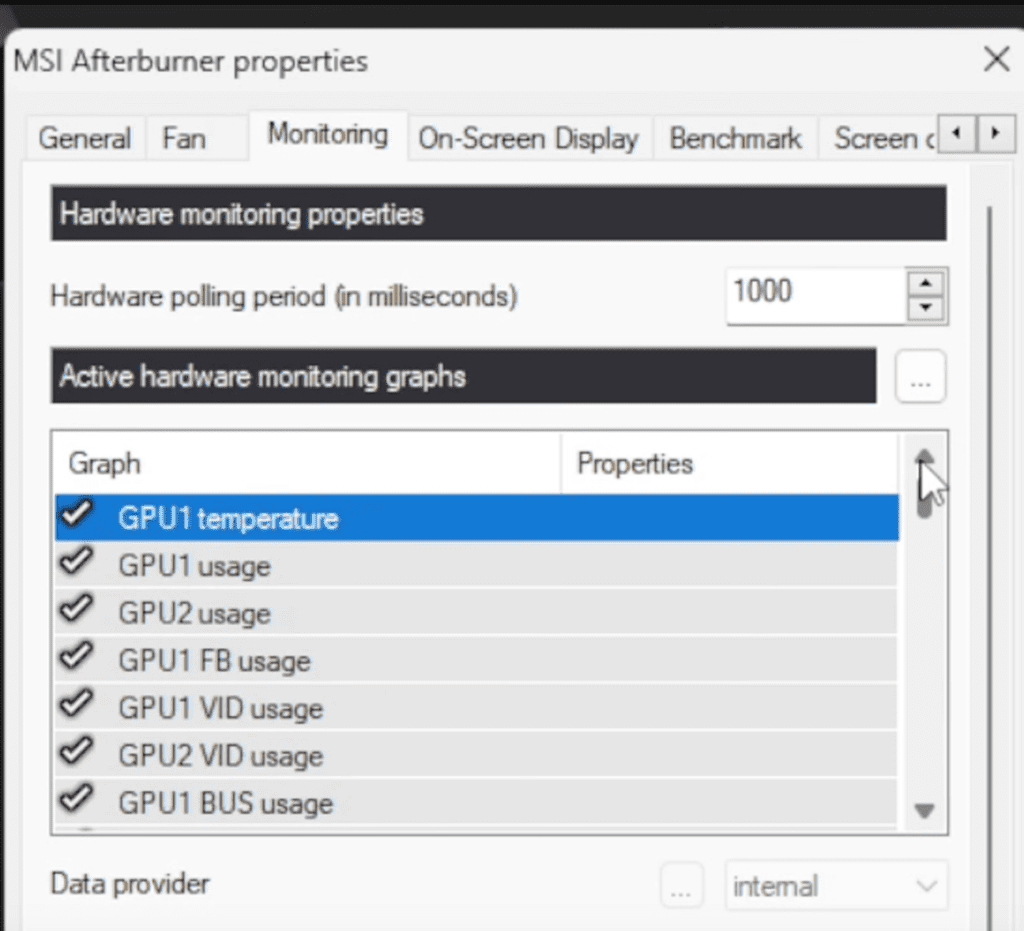
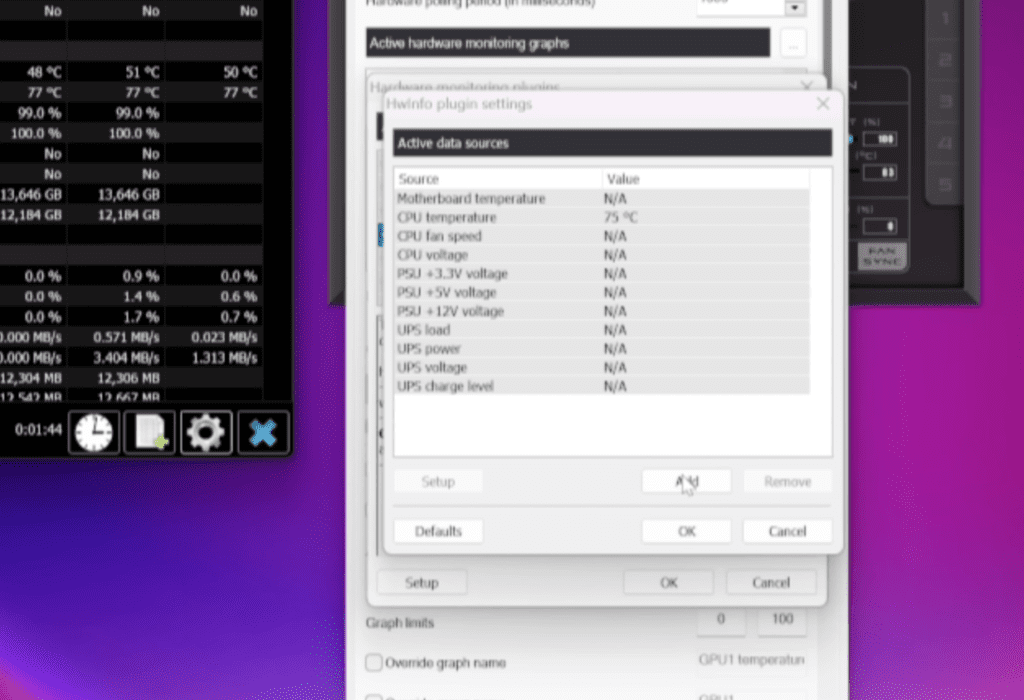
Now go to the Monitoring tab. Everything that is seen in game is controlled in this section.

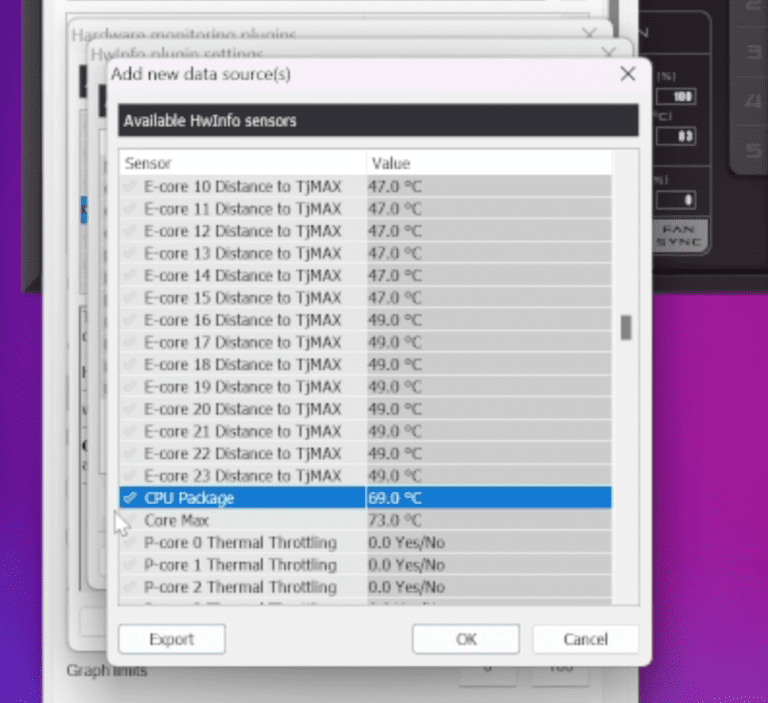
Enhance the following significant GPU statistics (one after another):

GPU temperature

GPU usage

GPU memory usage

GPU core clock

GPU power (TGP)

For each stat:
✔ Select the item
Clicking:✔ Check in On-Screen Display.

Configure CPU Monitoring
MSI monitoring

Step 4: Monitor RAM & FPS

You should also enable:

RAM usage

Frame rate (FPS)
You can show:

Real-time FPS

Average FPS

Maximum FPS

Minimum FPS

1% low FPS

The majority of reviewers are fond of real-time FPS + 1% low FPS.

Click Apply → OK.

You can now open a game and you will see little statistics in the corner.

Step 5: Increase the Size and Style of the On-Screen Stats

If the stats appear too small:

Click the arrow to the taskbar (bottom right of your windows screen).

Open RivaTuner Statistics Server (the icon is that of a small blue monitor).

Adjust:

On-Screen Display zoom (size)

Font style

Colors

Position

This allows you to tailor the appearance of the stats in games large, readable and easy to view.

RivaTuner Statistics Server
“HWInfo”
“HWInfo”
“HWInfo”

Step 6: If Some Stats Don’t Show — Use HWInfo

The newer CPUs and laptops tend to conceal some values, and not all of them are presented by default in MSI Afterburner.

To fix this:

Get on Google and search HWInfo and install the program.

Install and launch it.

Choose Sensors Only → Start.

HWInfo reveals all the information including:

Personal subcutaneous temperatures.

Power draw

Detailed clock speeds

Motherboard sensors

Storage temperatures

RAM timings

And more

Now turn on HWInfo communication:

In HWInfo → Configure Sensors

Go to Main Settings

Enable Shared Memory Support

Click OK

Step 7: Link HWInfo to MSI Afterburner

Open MSI Afterburner Monitoring tab Afterburner Settings.

Beside the graph of Active Hardware Monitoring, there are three dots.

Enable HWInfo.dll

Click Setup, then select Add

All HWInfo sensors are now displayed in MSI Afterburner.

Example:
In case you would like to get CPU Package Temperature (a composite temperature):

Tick CPU Package

Click OK

In order to arrange it, please specify the Group Name:
If it’s a CPU stat, type: CPU
In case it has to deal with the GPU: GPU 1 or GPU 2 (specific names).

This ensures that everything is well organized in the OSD.

Link HWInfo to MSI Afterburner

You’re Done! Monitor Your System Like a Reviewer

Once everything is set:

Launch any game

On-screen you will see your FPS, CPU temperatures, GPU temperatures, usage, clocks, RAM usage, etc.

The presence of overheating, bottlenecks, bad performance or hardware problems can be diagnosed immediately.

You can use them to look at the full picture of performance on whether you are testing a new laptop or looking at the PC that you have assembled on your own.

CPU Package Temperature

1 thought on “How to Monitor Your Laptop or PC’s CPU, GPU & FPS Stats”

Leave a Comment