

PC Tester Ultra
Know Your Machine
Version: v3.2.0
Size: 115.4 MB
Requirements: Windows 10/11 (64-bit)
Version: v3.2.0
Size: 108.2 MB
Requirements: macOS 11.0+ (Intel/M-Series)
Version: v3.2.0
Size: 98.1 MB
Requirements: Ubuntu, Debian, Fedora
Reality Over Specs
PC Tester Ultra provides a comprehensive local monitoring agent that scans system configurations, reads active telemetry, and performs real-time benchmarking for standard hardware architectures. By collecting low-level diagnostics, users can verify if their machine is performing at its rated specifications and diagnose hidden hardware bottlenecks.
CPU & GPU
Live performance forensics
Memory & Storage
Real-time usage audit
Network & Wireless
Connectivity diagnostics
System Health
Battery & thermal tracking
Stop relying on generic spec sheets. Start seeing the full potential of your hardware—and where it's holding back.
Interactive Diagnostic Dashboard
The local dashboard coordinates system status metrics, presenting a live telemetry breakdown of processing units, active memory pools, and network adapter latency.
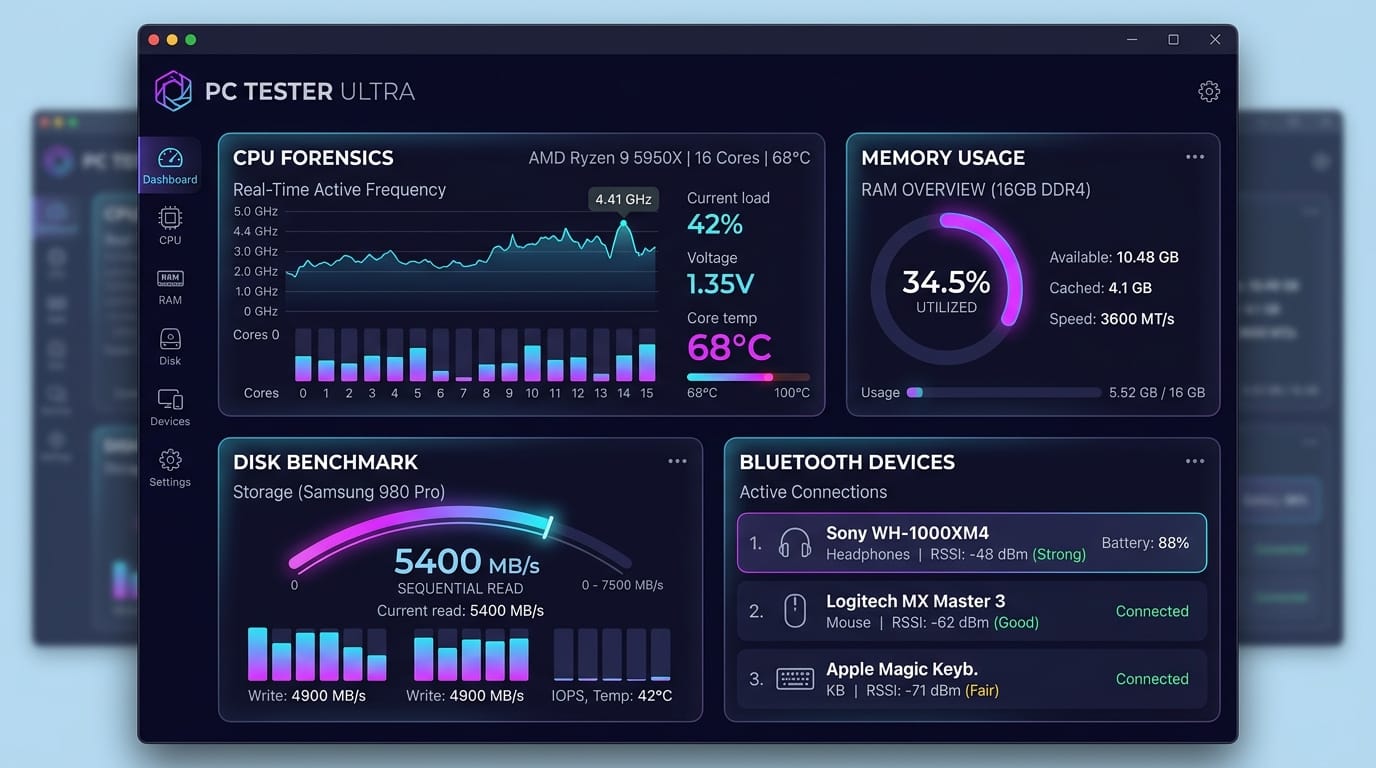
Figure 1: Production user interface screenshot of the PC Tester Ultra system telemetry dashboard, showing CPU diagnostics, memory allocation, and storage benchmarks.
*Note: Active browser sandboxes cannot read low-level motherboard thermal metrics directly due to host operating system security restrictions. The standalone local application executable is required to query motherboard hardware sensor buses.*
System Telemetry & Diagnostic Details
PC Tester Ultra evaluates the machine's hardware and network layers through nine dedicated diagnostic modules:
CPU Diagnostics & Forensics
Analyzes core and thread architecture, clock speed boundaries, and dynamic workloads. On hybrid processor architectures, the utility charts the task scheduler's distribution between Performance-cores (P-cores) and Efficient-cores (E-cores) alongside instructions like AVX-512, cache levels (L1, L2, L3), and thermal throttling telemetry.
Memory (RAM) Analysis & Deep Scanning
Identifies installed memory modules, verifying layout, clock speeds (e.g., DDR3/DDR4/DDR5 speeds), and configurations. The scan provides active memory allocation analytics, detailing physical utilization pools versus system virtual memory swap files.
GPU Diagnostics
Queries graphic processing unit details including model classification, dedicated VRAM capacity, driver versions, and compute API support.
Advanced Storage Analysis
Maps partition trees across active physical storage drives, tracking logical volumes, unallocated blocks, and formatting standards (NTFS, exFAT, APFS, EXT4).
- Physical Drives: Full hardware device layout
- Logical Partitions: Active partition structures and mount points
Real-Time Disk Speed Benchmarking
Runs throughput diagnostics on storage devices, measuring sequential read/write rates for large blocks and executing random 4K file test routines to simulate daily operating system workloads.
Measures maximum throughput limits for large media streams.
Simulates standard OS micro-file read/write actions.
Analyzes performance consistency under persistent file access.
Network Infrastructure & Diagnostics
Monitors active Ethernet, Wi-Fi, and virtual adapters. Instantly fetches local IP addresses, MAC addresses, default gateway values, DNS resolution metrics, and checks ping times.
Bluetooth Diagnostics & Peripheral Management
Tracks paired and actively connected Bluetooth devices (keyboards, mice, audio equipment). The diagnostic scan monitors signal strength indexes (RSSI), device types, and real-time battery status reporting where supported.
System Forensics & Hardware Health
Inspects base hardware telemetry including portable battery cycle counters, design capacity percentages, system BIOS/UEFI firmware build versions, serial numbers, and OS configuration details.
Stress Testing Suite
Push components to operational thresholds to verify thermal cooling solutions and power delivery stability under sustained workloads.
Short validation checks for baseline computer stability.
Sustained workloads simulating rendering or compilation tasks.
Maximized processing metrics testing thermal bounds.
Technical Specifications & Compatibility
PC Tester Ultra is optimized to execute low-latency hardware profiling across multiple client platforms. Below is the compatibility matrix for deployment:
| Operating System | Supported Architectures | Minimum Requirements | Recommended Specification | RAM Footprint |
|---|---|---|---|---|
| Windows | x86_64 (64-bit AMD/Intel) | Windows 10 (Build 19041+) | Windows 11 (22H2 or later) | ~22 MB (Passive Mode) |
| macOS | Intel x64, Apple Silicon (ARM64) | macOS 11 Big Sur | macOS 14 Sonoma (Universal Binary) | ~28 MB (Passive Mode) |
| Linux | x86_64, ARM64 | Ubuntu 20.04 LTS, Debian 11 | Ubuntu 24.04 LTS, Fedora 40 | ~18 MB (Passive Mode) |
Diagnostics Capabilities Matrix
PC Tester Ultra integrates a comprehensive array of hardware telemetries, performance benchmarks, and peripherals analyzers inside a unified interface:
| Diagnostic Category | Supported Capabilities | Methodology | Output Format |
|---|---|---|---|
| CPU & Processor Forensics | ✔ Core topology, P/E-core load, clock speeds, and thermal states | Passive hardware register reads & kernel APIs | Live telemetry charts & stats |
| Disk Speed Benchmarking | ✔ Sequential read/write & random 4K write throughput tests | Direct system I/O bypassing cache files | MB/s throughput & IOPS values |
| GPU & Graphics Profiling | ✔ VRAM usage tracking, driver validation, and compute API support | Graphics API bindings (Metal, DirectX, Vulkan) | Live memory graphs & specifications |
| Audio & Display Diagnoser | ✔ Micro-delay checks, monitor resolution audits, and mic testing | WASAPI/CoreAudio & EDID hardware queries | Interactive test modules |
| Bluetooth & USB Telemetry | ✔ Device inventory, battery query, and connection RSSI mappings | WinRT/CoreBluetooth & BlueZ/udev stack bindings | Signal strength map & profiles list |
Detailed Hardware Diagnostic Architecture
PC Tester Ultra operates via a secure native diagnostics framework designed to communicate directly with client kernel APIs. This approach eliminates intermediate translation overhead, enabling accurate reads of physical CPU registers, thermal junction interfaces, and storage controller tables.
Windows Framework (WMI & Win32)
Queries hardware tables using optimized WMI (Windows Management Instrumentation) channels. The tool hooks directly into Kernel-Mode Driver Framework (KMDF) bindings to bypass high-level API bottlenecks when reading real-time disk speeds and GPU memory buffers.
macOS Framework (IOKit & Apple Core)
Communicates with the macOS kernel through custom IOKit framework links. On Apple Silicon (M1/M2/M3/M4 chips), it accesses AppleSystemInfo interfaces to read internal GPU clusters, high-efficiency core structures, and battery cycles.
Linux Framework (Sysfs & /proc)
Operates through native POSIX interfaces, parsing raw virtual sysfs tables (like /sys/class/hwmon/ and /sys/devices/) to retrieve motherboard sensor details and parse hardware state structures without runtime virtualization layers.
Platform-Specific Installation & Troubleshooting
Windows Guide
Because PC Tester Ultra is a newly compiled standalone application, Windows Defender SmartScreen may display a warning dialog upon the first launch.
- 1. Click "More info" inside the Windows SmartScreen alert card.
- 2. Click "Run anyway" to safely initialize the secure diagnostics user interface.
macOS Setup
Apple Gatekeeper checks downloaded web applications to verify their source. If macOS Gatekeeper pauses execution, authorize the tool manually.
- 1. Open your Mac's System Settings > Privacy & Security pane.
- 2. Navigate to the Security block and select "Open Anyway" to execute.
Linux Operations
Browser-downloaded application packages on Linux systems do not have execution bits enabled by default. Enable run permission to start.
- 1. Right-click the file, open Properties, and check "Allow executing file as program".
- 2. Or configure the permission in terminal using the command:
chmod +x pctester-linux
Frequently Asked Questions
Does PC Tester Ultra slow down my computer?
No. PC Tester Ultra is a lightweight system profiling utility. When in passive monitoring mode, it consumes minimal system resources (<0.5% CPU, <20MB RAM). During stress testing, it will temporarily scale CPU utilization to 100% to evaluate thermals and stability, but this resource allocation ceases immediately once the test is completed.
Is PC Tester Ultra free?
Yes, PC Tester Ultra is completely free. Users can access hardware specifications, real-time disk benchmarks, Bluetooth inventories, and the stress testing suite without subscriptions or hidden costs.
What does thermal throttling mean?
Thermal throttling is a hardware safeguard. When components like your CPU or GPU exceed safe thermal limits (typically 90-100°C), they reduce clock frequency to mitigate heat generation. PC Tester Ultra indicates thermal throttling status to help diagnose cooling hardware bottlenecks.
Why does Windows or macOS show a security warning when opening PC Tester Ultra?
Because PC Tester Ultra directly accesses physical motherboard registers, sensor buses, and raw storage controller metrics, security systems like Windows Defender SmartScreen or macOS Gatekeeper may flag it as unrecognized. To open it, click 'More info' and 'Run anyway' on Windows, or click 'Open Anyway' under System Settings > Privacy & Security on macOS.
How does PC Tester Ultra query motherboard temperature sensors?
On Windows, it queries optimized WMI namespaces and uses direct Ring 0 kernel driver hooks to read hardware MSR registers. On macOS, it binds with the IOKit framework and AppleSystemInfo API. On Linux, it directly reads system monitoring directory trees under /sys/class/hwmon/.
Are the disk speed benchmarks accurate for NVMe and SSD drives?
Yes. PC Tester Ultra runs direct I/O write/read commands bypassing OS cache files, executing sequential block transfers and random 4K block loops to measure actual device throughput accurately.
Is PC Tester Ultra optimized for Apple Silicon (M-series) Macs?
Yes, it is distributed as a Universal Binary containing native builds for both Intel x86_64 and Apple Silicon arm64 (M1/M2/M3/M4) architectures, optimizing memory consumption and telemetry accuracy.
Written by Adeel Farooq
Lead Systems Administrator & Senior Analyst
Adeel Farooq is the Lead Systems Administrator and Senior Technology Analyst for PC-Tester, with over 13 years of experience in enterprise systems engineering, network infrastructure, and consumer hardware testing. He specializes in benchmarking computing hardware and designing optimal systems architectures. His work has appeared in multiple leading enterprise computing publications.